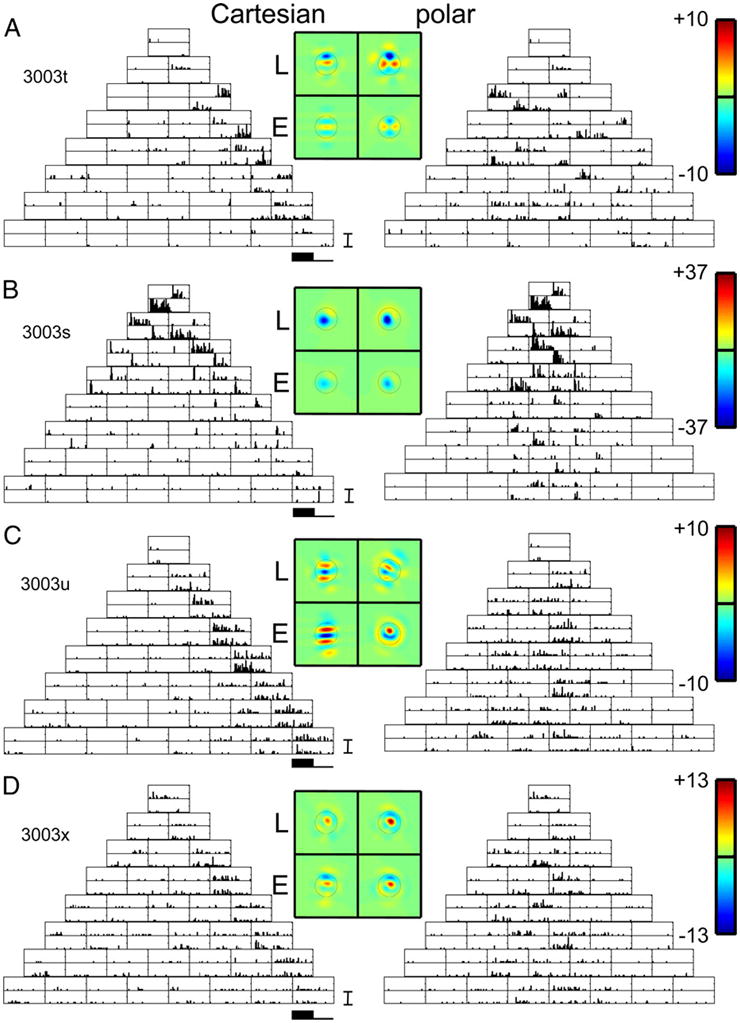
FIG. 3.

Poststimulus time histograms (PSTHs) of responses of 4 simultaneously recorded neurons in layer III of cat V1 to TDH functions (left; Cartesian stimuli; right polar stimuli), each presented for 250 ms and followed by 250 ms of mean illumination. In each pair of histograms, the top histogram is the response to the stimulus shown in Fig. 1, and the bottom histogram is the response to the contrast-inverse of that stimulus. Four pseudocolor maps represent the spatial filters Lcart, Lpolar, Ecart, and Epolar for the model of Fig. 4, derived as described by Eqs. 2 and 4. Circle on each color map is of diameter (D is the diameter of the circle in Fig. 2), which marks the point at which the Gaussian component of each Hermite function falls to e−2 times its peak value. For each unit, a common linear pseudocolor scale (color bar as shown in top right) is used for the 4 filters, with green representing 0, red representing the highest positive value, and blue representing the lowest negative value. For the units of panels A and B, there is at least a qualitative similarity of the filters L and E deduced from the 2 basis sets. For the unit of panel C, the shapes of the filters differ substantially. For the unit of panel D, there is a difference in the relative strengths of the linear and nonlinear components (L < E for the Cartesian functions. L comparable to E for the polar functions). A, B, C, and D: units 3003t, s, u, and x. PSTH scale bar: 100 impulses/s in all panels. Range for pseudocolor maps of filters: ±10 impulses/s (A), ±37 impulses/s (B), ±10 impulses/s (C), and ±13 impulses/s (D).
