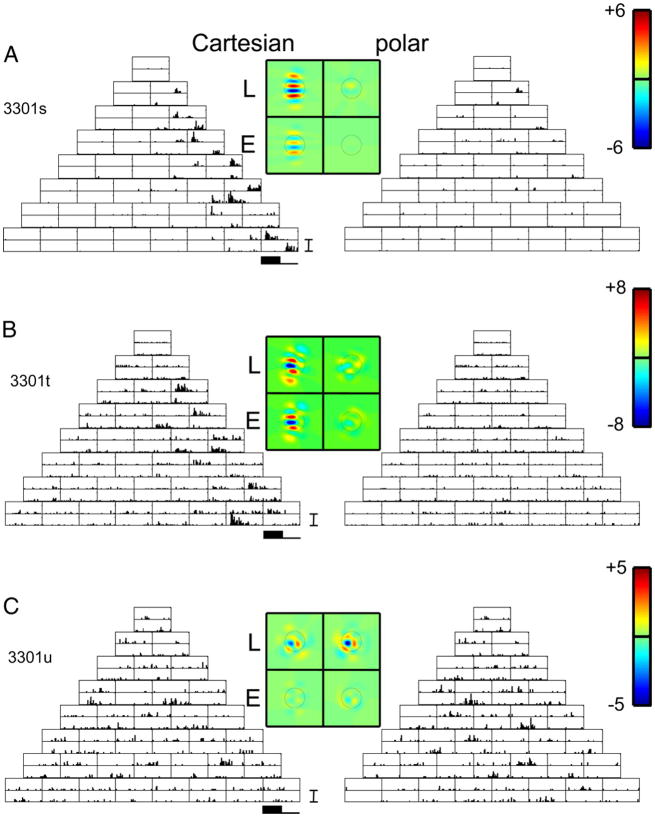
FIG. 5.
PSTHs of responses of 3 simultaneously recorded neurons in upper layer V1/lower V of cat VI to TDH functions. Data are displayed as in Fig. 3. Units of A and B respond nearly exclusively to the Cartesian stimuli; the unit of C responds in a similar fashion to both basis sets. A, B, and C: units 3303s, t, and u. PSTH scale bar: 75 impulses/s in A and B, 50 impulses/s in C. Range for pseudocolor maps of filters: ±6 impulses/s (A), ±8 impulses/s (B), and ±5 impulses/s (C).

