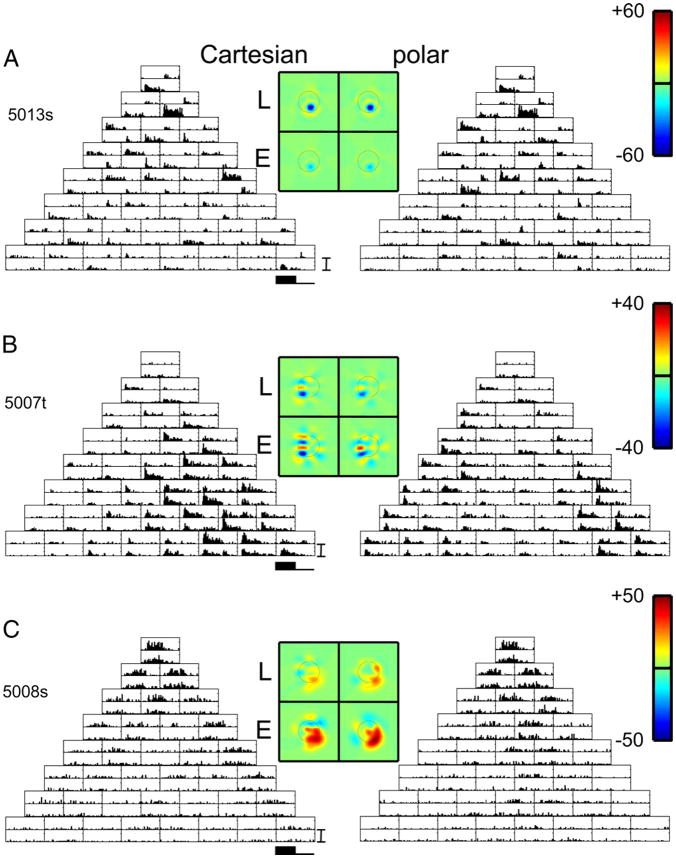
FIG. 6.
PSTHs of responses of 4 neurons at separate locations in macaque V1. Data are displayed as in Fig. 3. For the unit of A, but not for the other units, the filters L and E deduced from the 2 basis sets are similar. A, B, and C: units 5013s, 5007t, and 5008s. PSTH scale bar: 150 impulses/s in A and B, 75 impulses/s in C. Range for pseudocolor maps of filters: ±60 impulses/s (A), ±40 impulses/s (B), and ±50 impulses/s (C).

