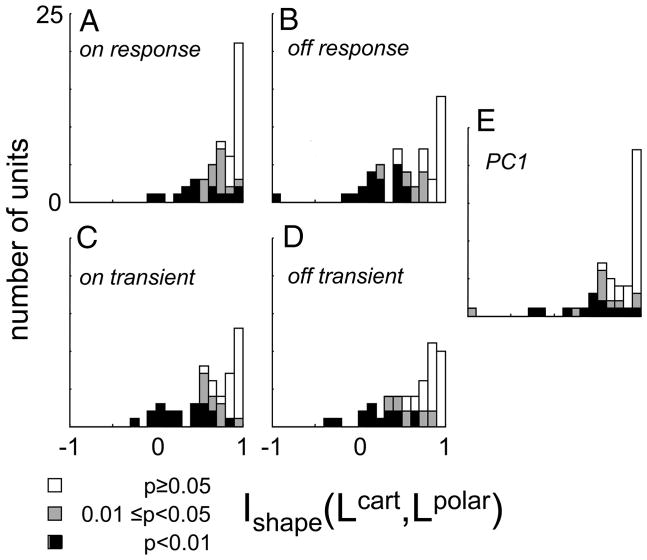
FIG. 7.
Distribution of the index Ishape (Lcart, Lpolar) (Eq. 8). Values <1 indicate different effective filtering behavior for Cartesian and polar stimuli. Portions of the histograms shaded black represent units for which values were significantly (by jackknife) <1 at P < 0.01; portions shaded gray are significant at 0.01 at P < 0.05; unshaded portions correspond to P > 0.05. Each panel contains calculations based on a different response measure.

