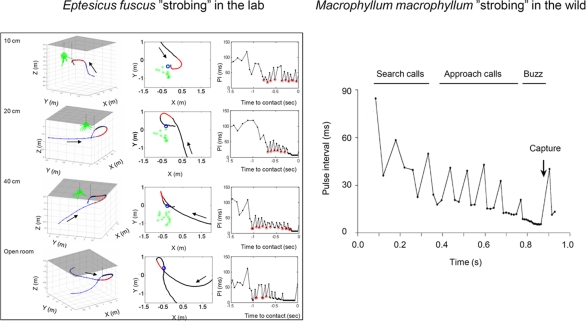
Figure 7.
Temporal adjustments of sonar calls in bats foraging in the lab (left, Eptesicus fuscus) and in the field (right, Macrophyllum macrophyllum). Both examples illustrate “sonar strobing” behavior, i.e. the production of sound groups with relatively stable intervals, as they approach prey. The far left panels are taken from typical laboratory trials and show 3D flight paths of bats as they take tethered insects in the vicinity of vegetation. The adjacent panels show overhead views of the same trials. Arrows indicate the direction of the flight path. The numbers in the upper left corner of each plot indicate the distance between the tethered insect and the vegetation, shown in green. Flight segments that contained “sonar strobe groups” are displayed in red. The pulse intervals for each of these four trials are plotted, and calls that fit the criterion for “sonar strobe groups” (<5% variation in PI) are circled in red. Adapted from Moss et al. (2006). Right, sonar strobing behavior taken from field recordings of M. macrophyllum. SC search calls, AC approach calls, TG terminal group, CM capture of mealworm. Adapted from Weinbeer and Kalko (2007).

