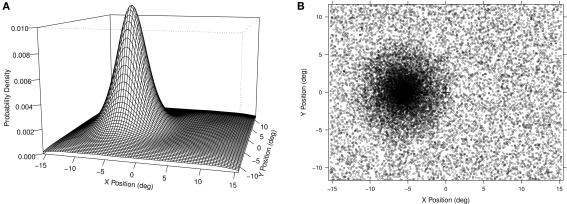
Figure 1.
(A) Left: The probability distribution for the left sided hotspot distribution is shown. The screen dimensions were 31° × 24° of visual angle and the center of the hotspot distribution was offset 5.6° to the left. The distribution had a linear decrease over a radius of 7.3° at which point it blended in to a background uniform probability. (B) Right: The actual experimental distribution collapsed across all 12 participants. Each point indicates the location of one trial for one participant. Note that for half of the participants the hotspot was actually on the right side, but we have reflected the data here to aid visualization.

