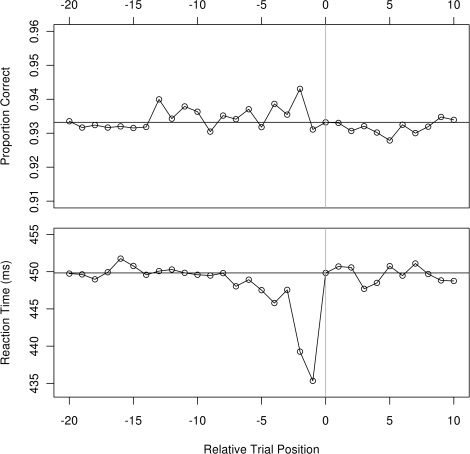
Figure 5.
Accuracy (above) and correct trial RT (below) in Experiment 1 as a function of whether the trial n back had the same stimulus color and thus required the same response. Mean values are seen at n = 0 and at the corresponding horizontal lines. A future stimulus cannot prime a current one, so the future trial contingencies serve as a visual reference for variability in the data.

