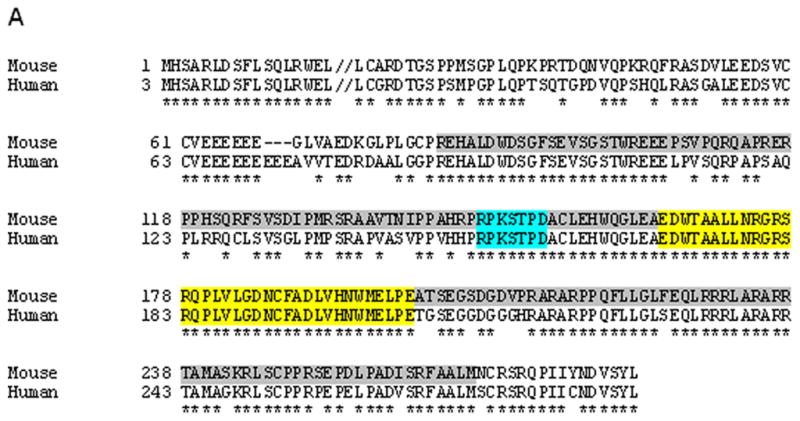
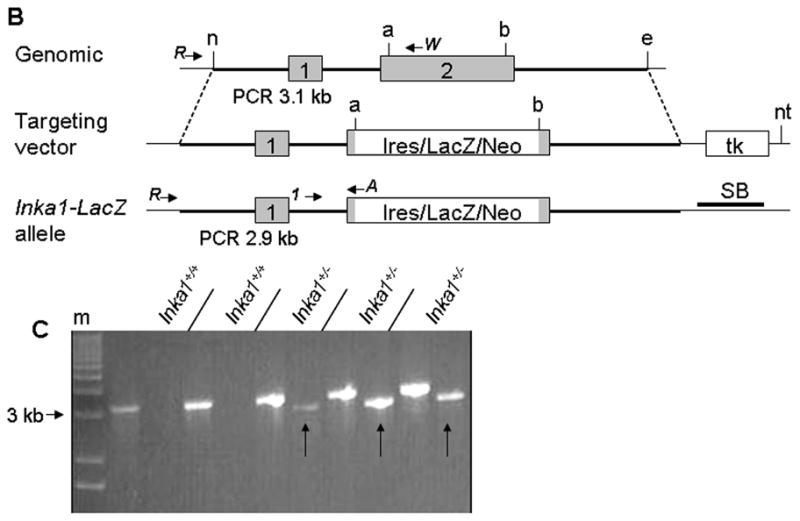
Figure 1. Generation of an Inka1-LacZ knock-in allele.


A) Protein alignment of Inka1 mouse and human sequences. Grey shaded region represents deletion in exon 2 of the targeting construct. Exons 1 and 2 are distinguished by the double back slash in the first line. Blue and yellow regions represent the 14-3-3 binding domain and “Inka1-box,” respectively. Alignment made using SIM (http://ca.expasy.org/tools/sim-prot.html). Human accession number BC012170.1, mouse accession number AK020090.1. B) Diagrammatic representation of the normal Inka1 locus (top), the targeting vector (middle), and the genomic locus following successful targeting. PCR primers used for screening and genotyping are illustrated as arrows. a – AvrII, b – BspHI, e – EcoRI, n – NheI, nt – NotI, tk – thymidine kinase, SB – Southern blot probe. Inka1-LacZ construct not drawn to scale. C) Representative PCR results from ES cell screening, m – marker, arrows indicate positive clones.
