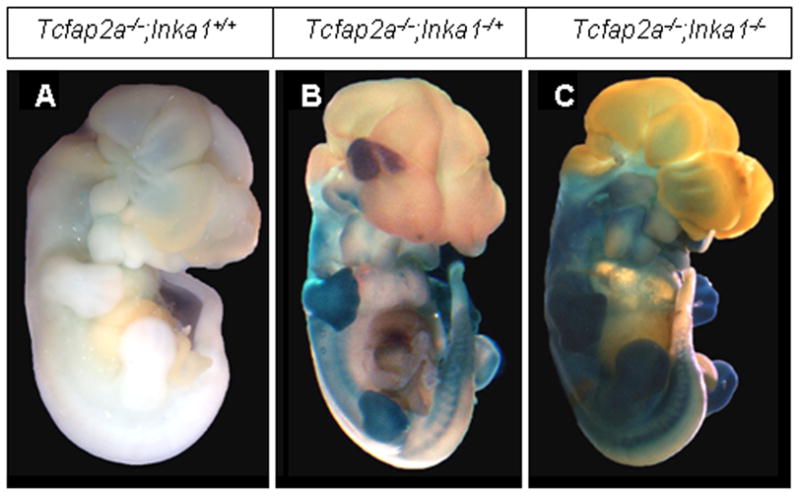
Figure 5. Analysis of Inka1 expression in Tcfap2a−/− mice.

A–C) Lateral views of E12.5 Tcfap2a null mice that are wild-type (A), heterozygous (B) or homozygous (C) for the Inka1-LacZ allele. Embryos are stained with X-gal to show expression of Inka1.
