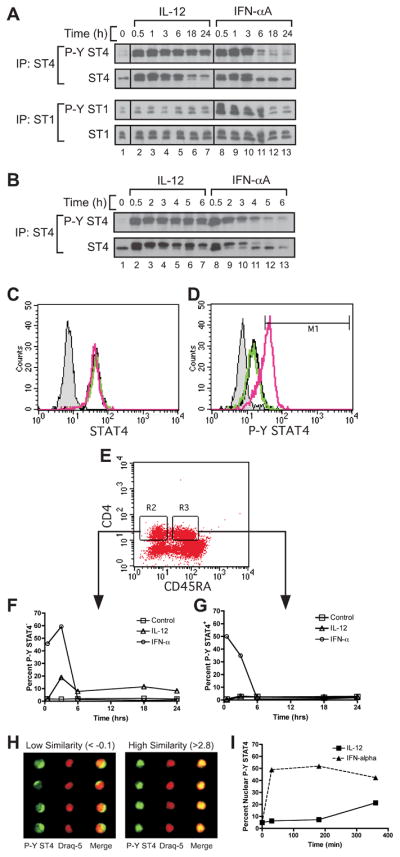
Figure 4. IL-12 and IFN-α differentially regulate the kinetics of STAT4 tyrosine phosphorylation in human CD4+ T cells.

A and B, Human PBMCs were activated and expanded for two consecutive weeks with PHA in the presence of IL-2 and IL-12. On day 14, cells were rested in fresh medium for 30 minutes and stimulated with either IL-12 or IFN-αA for the indicated periods of time. Immunoprecipitation was performed using polyclonal antisera for human STAT4 or STAT1, and Western blotting was performed for phosphorylated STAT4 or STAT1, as indicated. Membranes were then stripped and re-probed for total STAT4 or STAT1. A, Time course of STAT4 and STAT1 phosphorylation in human Th1 PBMCs stimulated with IL-12 (lanes 2–7) or IFN-αA (lanes 8–13) for 0–24 hours. B, Time course of STAT4 phosphorylation in human Th1 PBMCs stimulated with IL-12 (lanes 2–7) or IFN-αA (lanes 8–13) for 0–6 hours. C through G, Freshly isolated PBMCs were activated with medium alone, IL-12, or IFN-α at various time points up to 24 hours. Cells were stained for CD4, CD45RA, and intracellular STAT4 and phosphotyrosine STAT4 (P-Y STAT4) as described in the Materials and Methods. C and D, Total STAT4 (C) and P-Y STAT4 (D) were measured from cells activated for 30 min by flow cytometry. Data are gated on live, CD4+, and CD45RA+ cells. Black line, unstimulated; green line, IL-12 stimulated; red line, IFN-α stimulated; gray shaded, non-immune rabbit Ig control. E, Gating scheme is shown for the analysis of CD4+, CD45RA- (R2) and CD45RA+ (R3) cells. F and G, CD45RA- (F) and CD45RA+ (G) gated cells are represented as a percentage of cells that display increased P-Y STAT4 staining over a 24 hour period. Open square, unstimulated; open triangle, IL-12 stimulated; open circle, IFN-α stimulated. H and I, Human PBMCs were activated and stained as above and analyzed on the ImageStream® imaging flow cytometer. Single cell images were gated on the live, CD4+, and CD45RA+ populations. H, Cells displaying positive staining for P-Y STAT4 were categorized for either low similarity (left panel) or high similarity (right panel) of co-localization of P-Y STAT4 within the nucleus based on nuclear dye staining (Draq-5). I, Cells displaying elevated P-Y STAT4 staining were quantified for co-localization of P-Y STAT4 within the nucleus of cells treated with IL-12 (closed square) or IFN-α (closed triangle).
