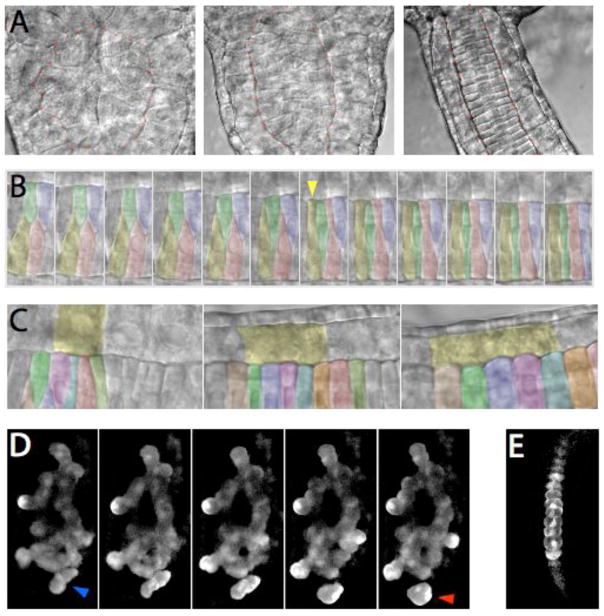
Fig. 2. Timelapse analysis of ascidian notochord boundary formation.
(A–C) Nomarski timelapses of notochord boundary formation in the highly transparent ascidian Ascidiella aspersa.
(A) Emergence of a morphologically distinct notochord boundary (marked with orange dots). Frames are 100 minutes apart.
(B) Cell behaviors at the notochord boundary late in intercalation. Note the rapid spreading of the yellow cell as it contacts the boundary (indicated by the yellow arrowhead), while the adjacent green cell becomes temporarily displaced. Frames are 3 minutes apart.
(C) Gradual shearing of muscle cells (one marked in yellow) versus notochord cells along the notochord boundary. Frames are 75 minutes apart.
(D) Confocal timelapse of bra:GFP fluorescence in a chm/chm Ciona savignyi embryo. Anterior is to the top. Note the small group of cells in the first frame (blue arrow) that break away from the main mass of the notochord and migrate towards the tip of the tail (red arrow in the final frame). There is also considerable movement of cells at the notochord boundary, especially on the bottom right side of the image. Frames shown are 16 min apart.
(E) shows a single frame of bra:GFP fluorescence in a wildtype sibling imaged just after the timelapse in D was completed.

