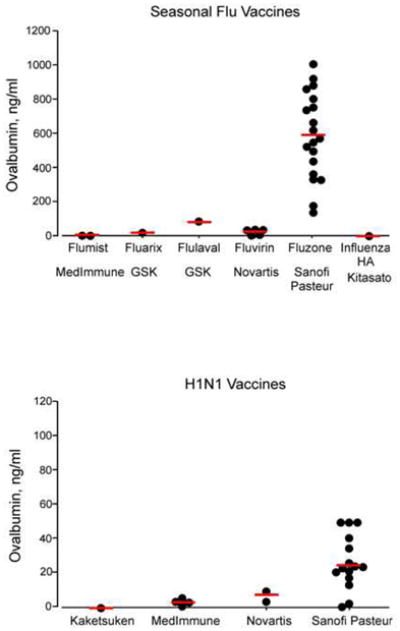
Figure 1.

Ovalbumin levels in different lots of seasonal and H1N1 vaccines. Each dot represents the ovalbumin level in each lot. Figures show 29 lots from 6 products, 5 manufacturers (seasonable) and 22 lots from 4 manufactures (H1N1). Please note the difference in y-axis scale for seasonal and H1N1 vaccines. Horizontal bars represent medians.
