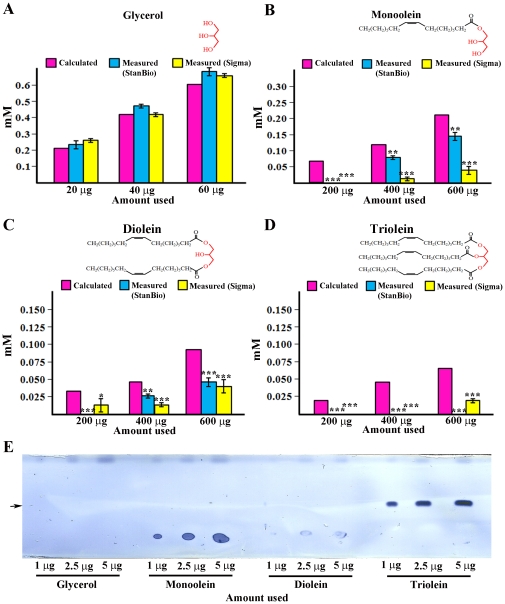
Figure 3. Coupled colorimetric assays cannot distinguish triglyceride from other glycerides.
Glycerol (a soluble compound) can be accurately measured using either kit (A). Increasing amounts of monoolein (B) and diolein (C) produce increasing quinoneimine absorption with either kit. However, the values obtained are not in agreement with the known amounts (pink bars). Triolein (a pure triglyceride) produces no signal with the StanBio kit, and a small signal with the Sigma kit at the highest amount tested. (D). Much lower amounts of monoolein and triolein can be readily detected using the TLC assay (E) (arrow indicates the triglyceride band). Diolein bands do not stain well, and glycerol cannot be detected at all with the TLC assay. Cartoons of the glyceride structures are shown above the graphs in (A–D), with the glycerol backbone indicated in red. Error bars are standard deviations of four different replicates for a given sample type. Asterisks denote T-test statistical significance: *; P<0.05–0,005, **; P<0.005–0.0005, ***; P<0.0005.

