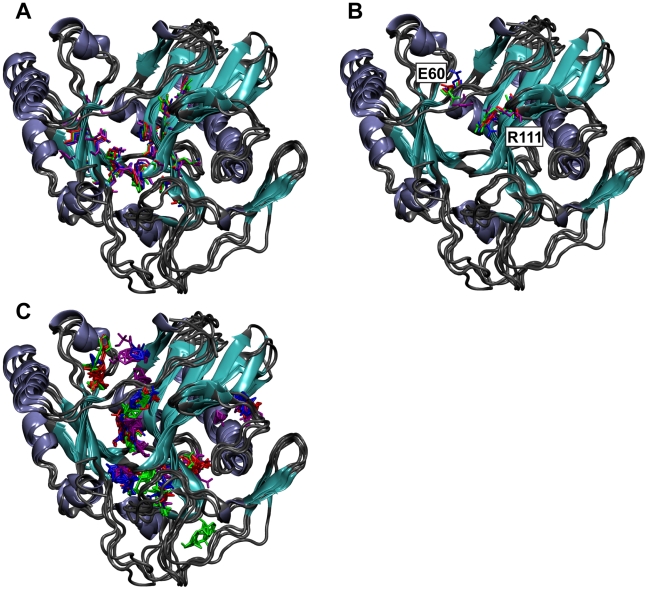
Figure 4. The centroids of the three most populated RMSD clusters aligned to the TbREL1 crystal structure.
Coils are colored gray, sheets are colored cyan, and helices are colored ice blue. A) Residues lining the deep end of the binding pocket used for RMSD clustering are shown in a licorice graphical representation. Residues from the centroid of the first, second, and third most populated clusters are shown in red, blue, and green, respectively. Residues from the crystal structure are shown in purple. B) E60 and R111 conformational variability. Coloring is as in A). The orientation of E60 in the centroids of the top two most populated clusters differs from that of the third cluster, as well as from that of the crystal structure. C) Consensus binding sites of the organic solvent probes used in the computational fragment mapping analysis. Solvent probe clusters are colored to match the coloring in A) and B).

