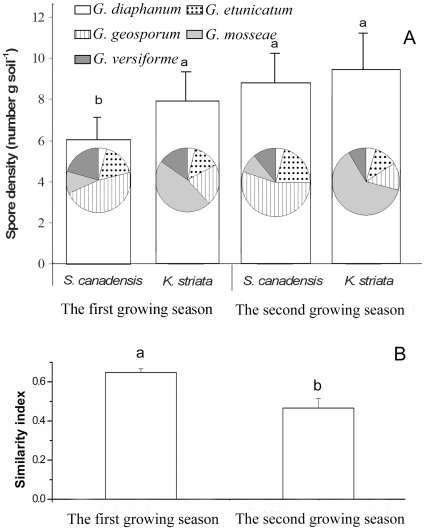
Figure 1. Numbers of AMF spores (total and by AMF species) in soil grown with invasive S. canadensis or native K. striata in two growing years in experiment 1.
Bars represent total spore numbers of the five AMF. Inset pie charts represent spore composition of the AMF species. Values are means ± standard error. Means with different letters are significantly different at the 5% level.

