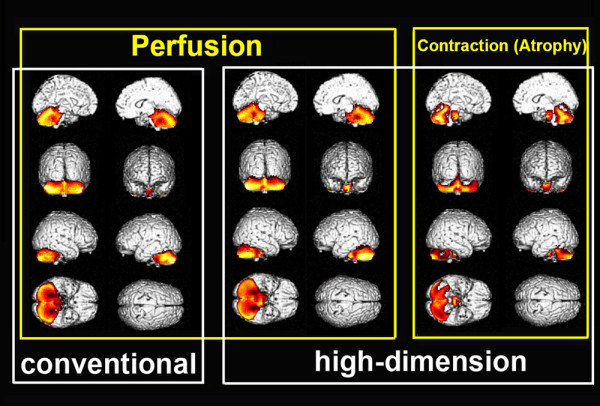
Figure 5.

Group comparison of warped SPECT and contraction images between MSA-C patients and normal controls. High-dimension-warping demonstrates significantly decreased perfusion and significant contraction indicating local atrophy as a colored map in the whole cerebellum and pons of MSA-C patients as compared to normal controls. Conventional warping also demonstrated significantly decreased perfusion in the same area as in the high-dimension warping.
