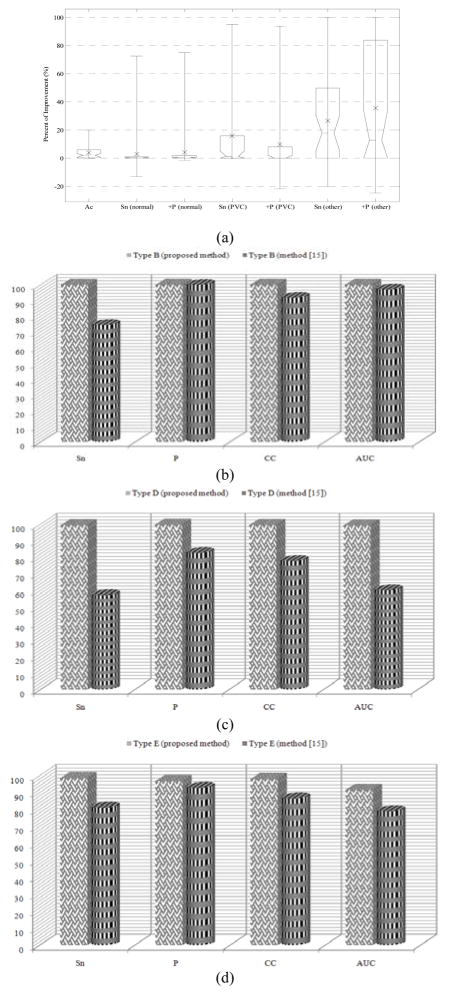
Fig. 5.
Performance comparison of the proposed method to the wavelet-based NN algorithm [17], evaluated on the same 40 records from MIT-BIH Arrhythmia Database. (a) Improvement statistics for the whole database shown with box plots. The box lines show the lower quartile, median (dotted) and upper quartile improvement values, and the error-bars indicate the min and max improvement values. The mean improvement is shown with a cross symbol, (b)–(d) comparative results for PVC detection using type B, type D, and type E signals, respectively. The results of our proposed method are shown by box bars while those of [19] are shown with cylindrical bars.

