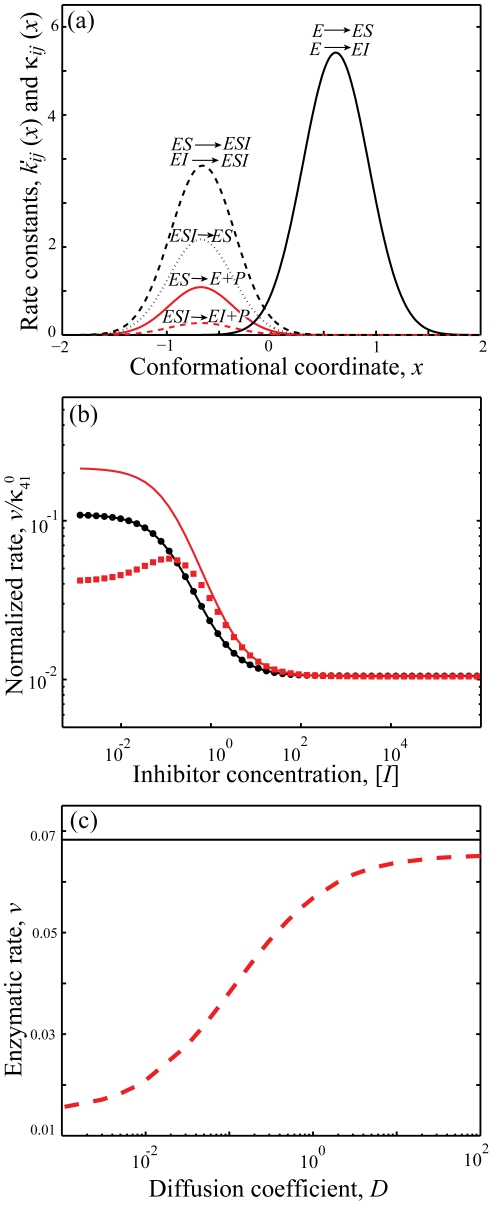
Figure 3. Numerical results for the partial noncompetitive inhibition reaction.
a) Rate constants κij (x) and kij (x) as function of the conformational coordinate x, with parameters given in Tables 3 and 4 calculated using Eq. (34) and  . b) Normalized rate
  as a function of concentration [I] at a fixed concentration of [S] = 1. When catalytic reaction is fast with
  and
and  Slow diffusion in ES conformation leads to an increase in the rate at low and intermediate inhibitor concentration followed by a decay (red squares), a deviation from the macroscopic rate law(red solid line) computed from equation (A.3). For slow catalysis (
 , quasi-equilibrium limit) normalized rate
  has the same dependence on I concentration (black circles) as the macroscopic rate law(black solid line) calculated from equation (B.7). We use DES = 10−2 and DE = DEI = = DESI = 102 and the rest of parameters as in (a). c) Enzymatic rate as a function of conformational diffusion. We took all the diffusions to be the same DE = DES = DEI = DESI = D. For fast catalysis
  and
and  the enzymatic rate decreases with decreased diffusion (red dashed line). In the quasi-equilibrium limit, when the catalysis is slow
  the enzymatic rate does not depend on the diffusion coefficient (black solid line). Notably the same trend continues with further decrease in diffusion coefficients, D. We use [S] = 1, [I] = 0.1 and the remaining parameters as in (a, b).

