
Figure 1.
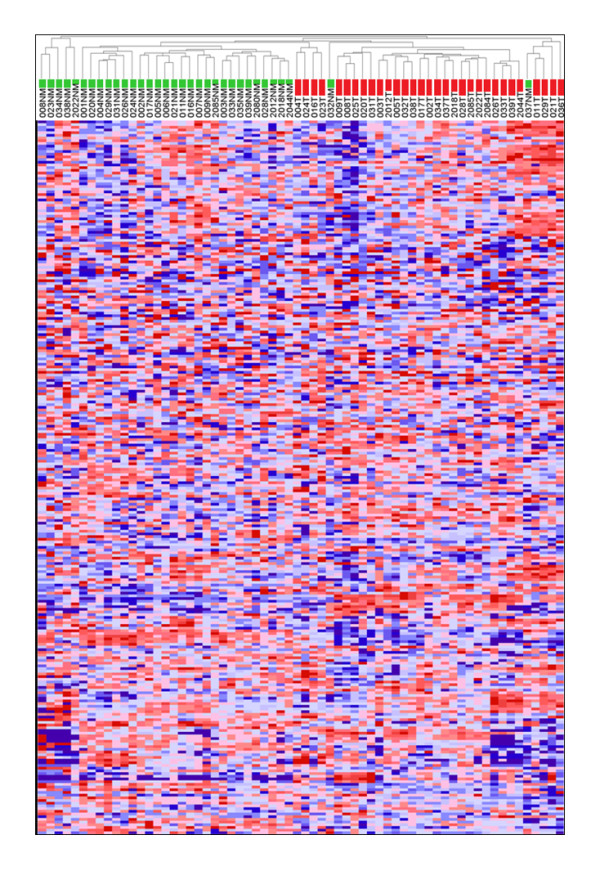
Unsupervised hierarchical cluster analysis of tumour and normal mucosa spectra. The dendrogram and heatmap show the clustering of Tumour (T) and normal mucosa (NM) spectra using Euclidean correlation as the column distance measure with pair-wise average linkage as the clustering method. Row clustering (not shown) used Spearman's rank correlation as distance measure with pair-wise complete linkage as the clustering method. Specimens are colour-coded as green (NM) and red (T).