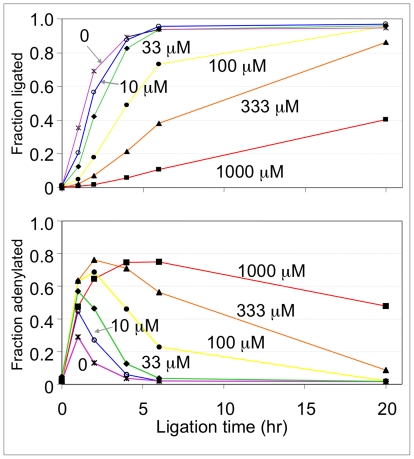
Figure 3. ATP titration.
Ligation reactions were carried out with radiolabeled dCHr8 and non-labeled A2G bridge in the presence of ATP at concentrations of 0 (asterisks), 10 (open circles), 33 (diamonds), 100 (filled circles), 333 (triangles) or 1000 (squares) µM. Top, plot of the fraction of dCHr8 converted to full-length ligation product vs. time at the ATP concentrations indicated next to each curve in micromolar units. Reactions were carried out at 20°C with T4 DNA ligase concentration fixed at 3.7 µM. Samples were taken at 0, 1, 2, 4, 6, and 20 hours. Bottom, plot of the accumulation of adenylated intermediate in the same reactions shown in the top panel.

