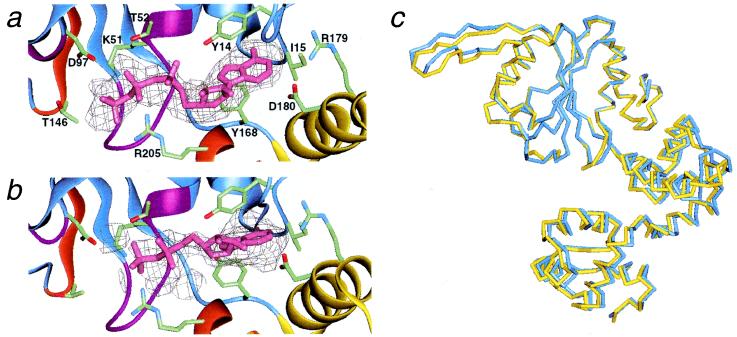
Figure 2.
Electron density maps and ribbon models of nucleotide-binding sites in the two ncs subunits. Possible residues that interact with nucleotides are depicted: Y14, I15, Y168, R179, and D180 are in contact with the adenine bases; K51 and T52 (Walker A), D97 (Walker B), T146 (Sensor I), and R205 (Sensor II) may interact with the phosphate groups. The stick models of (a) AMPPNP and (b) ADP were represented with corresponding simulated annealed Fo − Fc omit maps at a 1.5σ contour. The nucleotide atoms were omitted from the map calculation. Ribbons corresponding to the two sensor motifs and the two Walker motifs are indicated by the same color as in Fig. 1c. (c) Structural differences between the “A” (blue) and “B” (yellow) forms. Here, only the Cα backbones of domain N (ATPase domain) were superimposed between the two ncs molecules.

