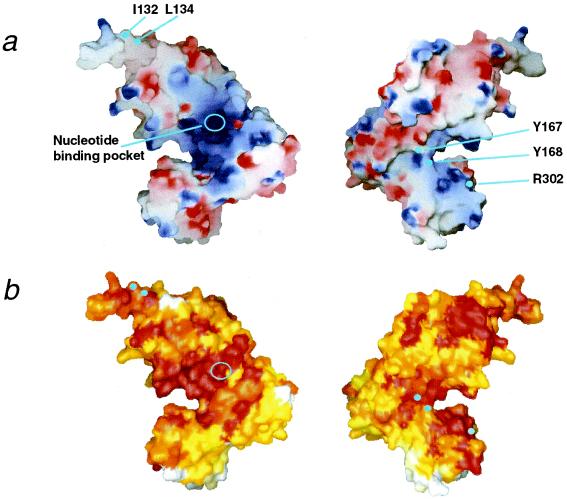
Figure 3.
Characteristics of the RuvB molecular surface. (a) Electrostatic potential calculated with grasp (33) and (b) amino acid conservation, calculated with clustalw (34) and Toh's modified program (7) and based on 18 RuvB homologues, were mapped onto the grasp molecular surfaces by gradation coloring. Blue and red in a represent positively and negatively charged regions on a scale from −10.5 to +10.5, respectively, and white and red in b indicate low and high values of conservation, respectively. Perspectives are the same as in Fig. 1a on the Left and are from the rear on the Right.

