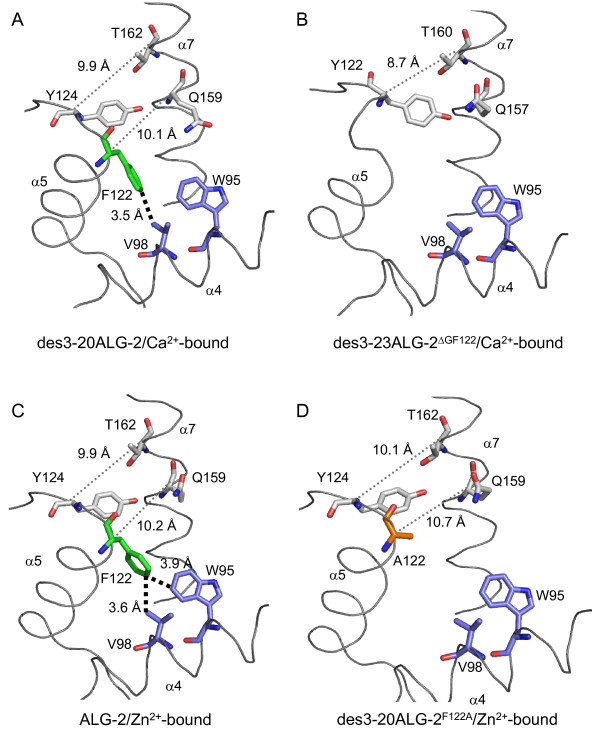
Figure 6.
Close-up views of structural interrelations among α4, α5 and α7. Residues influencing space size in the hydrophobic pockets are shown in stick models and described in Discussion. Thick dotted lines represent hydrophobic interactions. Thin dotted lines indicate Cα-distances that show differences in the pockets between wild-type and mutant ALG-2 structures. In the stick model representation, carbons atoms are colored in blue for W95 and V98, green for F122, orange for A122 and gray for Y124, Q159 and T162.

