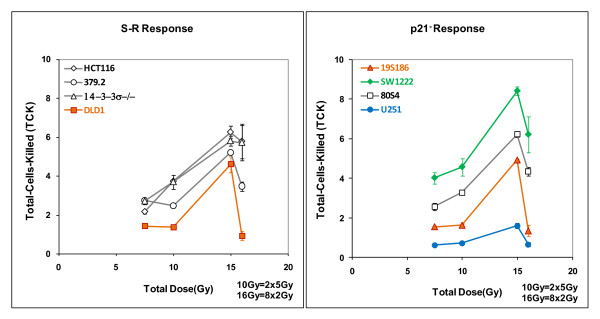
Figure 6.
Tumor response compared to total dose for eight cell lines and four radiotherapy protocols. Specific Growth Delay in days is compared to total dose delivered for the entire protocols. Tumors were irradiated either with two doses delivered as a single fraction (7.5 or 15.0 Gy) or with two fractionated regimens (2 fractions of 5 Gy each or 8 fractions of 2 Gy each). Responses to acutely delivered single fractions are connected by solid lines; responses to fractionated protocols are connected by dotted lines for each tumor type. The scales are different in the two panels and all data in the left hand panel falls within the dashed trapezoid shown in the right hand panel.

