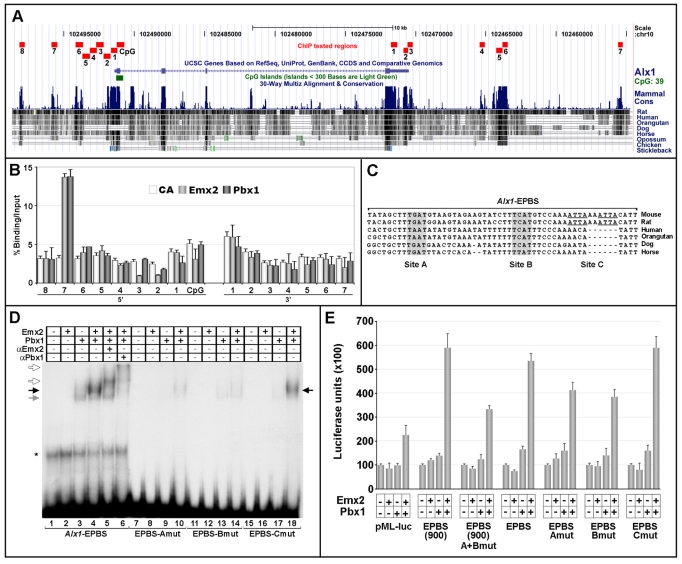
Fig. 7.
Pbx and Emx2 bind in vivo and cooperatively regulate transcription at a putative Alx1 regulatory element. (A) Interspecies comparison of genomic sequences spanning ∼25 kb around Alx1. Alignments to chr10:102498500-102455000 mouse genomic sequences (July 2007/mm9 assembly) were performed using the UCSC Genome Browser (Kent et al., 2002). The conserved genomic regions analyzed by ChIP, their sizes and positions are indicated in red. (B) ChIP of Emx2 or Pbx binding to genomic sequences spanning Alx1. The graph represents the average enrichment of control antibody (white), Emx2-bound (light gray) or Pbx-bound (dark gray) Alx1 genomic regions, as assessed by semi-quantitative PCR. Values indicate the percentage ratio between DNA amounts in immunoprecipitates (IP) and input chromatin. Error bars represent the mean percentage IP/input ratio ± s.e.m. of at least three independent ChIPs for each sample. (C) Interspecies alignment of a 54 bp sequence (Alx1-EPBS) within the Alx1 5′-7 region containing possible Emx2-Pbx binding sites. TGAT (Site A) and TCAT (Site B) core motifs are in gray. Two non-conserved ATTA motifs (Site C) are underlined. (D) Emx2 and Pbx1 cooperatively bind the Alx1-EPBS sequence via the TGAT and TCAT motifs. EMSA using the Alx1-EPBS, or the EPBS-Amut, EPBS-Bmut and EPBS-Cmut oligonucleotides as probes. Black arrow indicates the Emx2-Pbx1 heterodimer; gray arrow indicates a retarded complex formed by Pbx1 alone; white arrows indicate the supershifted Emx2-Pbx1 complexes. (E) Luciferase activity, in arbitrary units, assayed from P19 cells transiently transfected with the pMLAlx1-EPBS(900) [EPBS(900)] or pMLAlx1-EPBS (EPBS) reporters, or their mutated derivatives [EPBS(900)A+Bmut, EPBS-Amut, EPBS-Bmut, EPBS-Cmut] together with Pbx1 and/or Emx2 expression constructs. Bars represent mean luciferase activity ± s.e.m. of at least four independent experiments.

