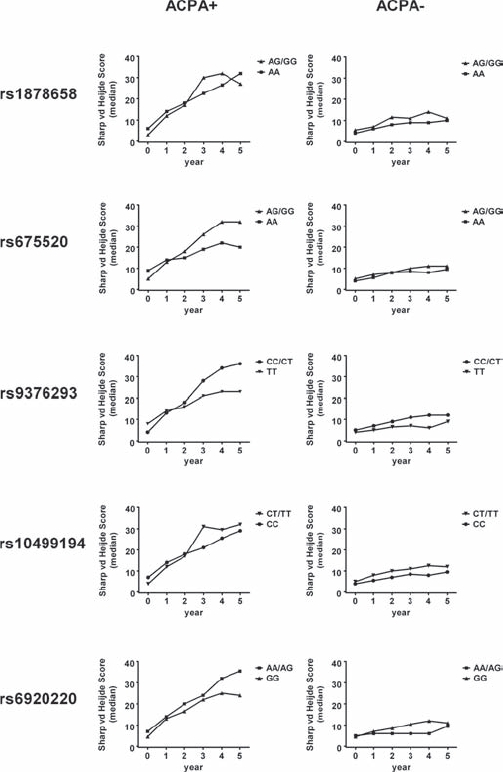
Figure 1.

Development of median Sharp van der Heijde scores plotted according to genotype/allele in ACPA+ (left column) and ACPA− (right column) patients with RA. Year 0 equals baseline-values. Regression analysis was performed in order to estimate the average increase (slope) in Sharp van der Heijde scores over time. Slopes were subsequently compared using the non-parametric Mann–Whitney test (for the ACPA+ subgroup: p=0.37 (rs1878658); p=0.007 (rs675520); p=0.021 (rs9376293); p=0.05 (rs10499194); p=0.76 (rs6920220)).
