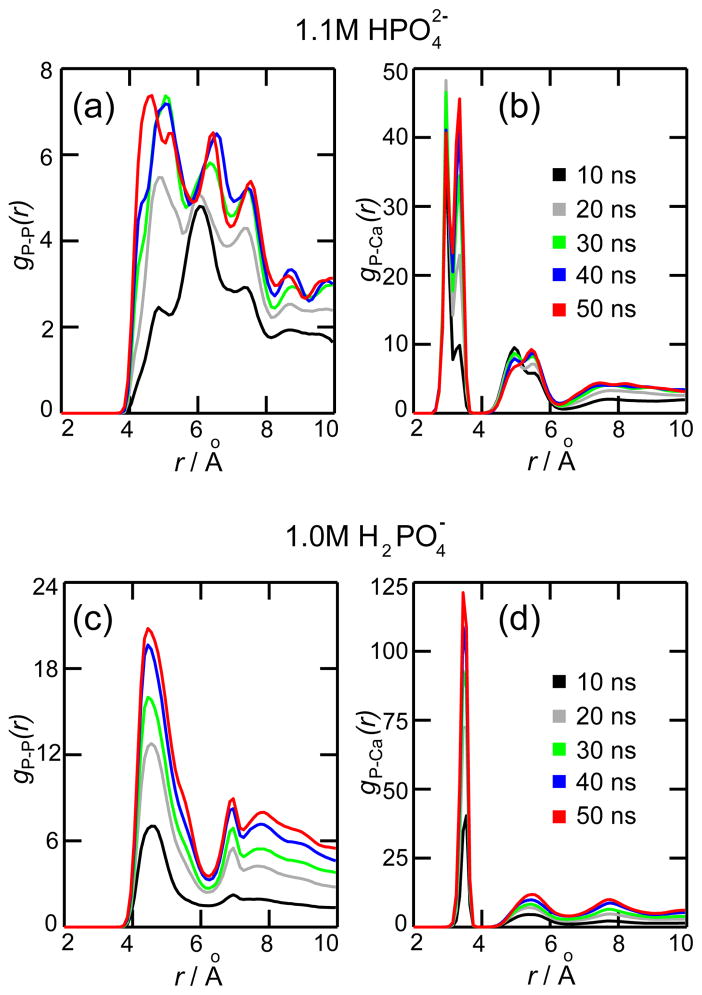
Figure 3.
Radial distribution function g(r). The figures present g(r) for calcium phosphate solutions containing 1.1 M (a,b) and 1.0 M (c,d). Each line presents g(r) averaged over a 10 ns period: 0–10 ns (black), 10–20 ns (gray), 20–30 ns (green), 30–40 (blue) and 40–50 ns (red). The g(r) values were calculated for phosphorus-phosphorus atom pairs (a,c) and phosphorus-calcium atom pairs (b,d).

