Figure 5.
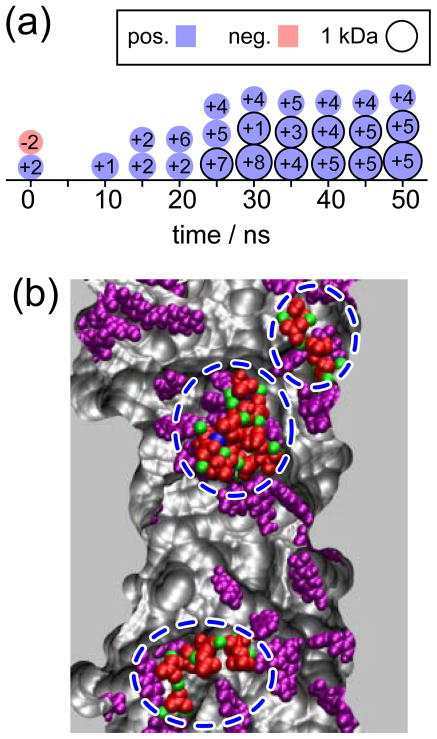
Precipitation in PET nanopores. Panel (a) shows a schematic representation of CaHPO4 precipitation observed in simulation 10. Each precipitate is represented as a circle; the radius is proportional to the cube root of the mass, the charge is color coded and labeled in each circle. Panel (b) shows a snapshot of the final frame of the simulation. The nanopore is shown sliced in the middle, the negatively charged PET residues are shown in purple. , Ca2+ and K+ ions are colored in red, green and blue, respectively. The three precipitates are highlighted with dashed blue lines. Water molecules and ions that are not part of precipitates are not shown. A movie showing this MD simulation is provided in Supporting Information.

