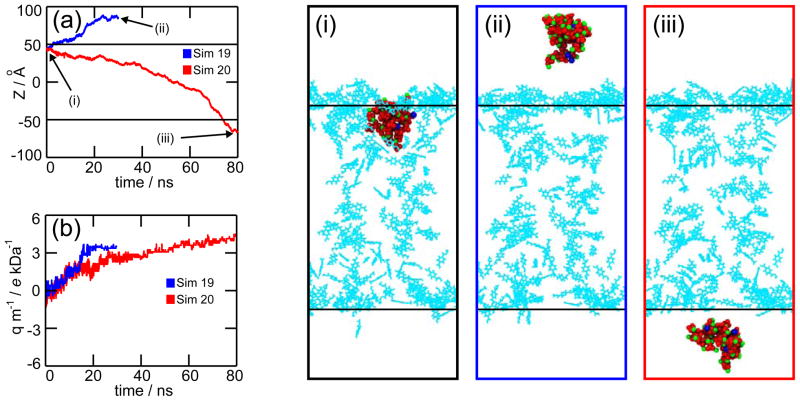
Figure 9.
Total reprotonation. Plots depict the Z-coordinate of the precipitate’s center of mass (a) and its charge/mass ratio (b) for simulations 19 (blue) and 20 (red). The snapshots on the left side show: starting conformation for simulations 19 and 20 (i), and final frames for simulations 19 (ii) and 20 (iii). Reprotonated carboxyl groups are pictured as cyan lines. The black horizontal lines in panels (a), (i), (ii) and (iii) are guidelines to locate the top and bottom pore openings. Movies are provided in Supporting Information.

