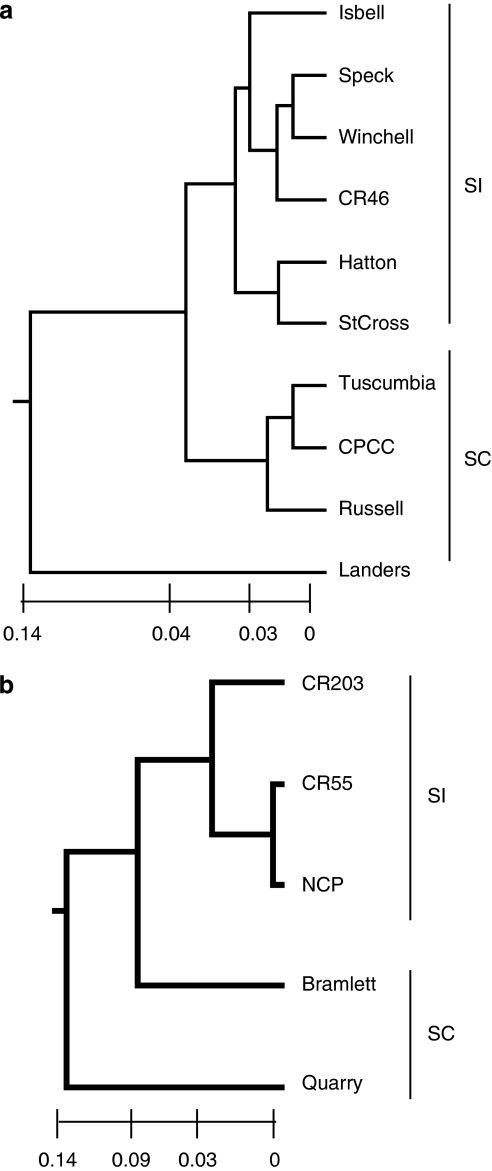
Figure 2.
UPGMA phenograms of 10 L. alabamica and 5 L. crassa populations based on Nei's (1972) genetic distance values: (a) L. alabamica populations, (b) L. crassa populations. Branch lengths represent genetic distances (see scale). SI=self-incompatible, SC=self-compatible.

