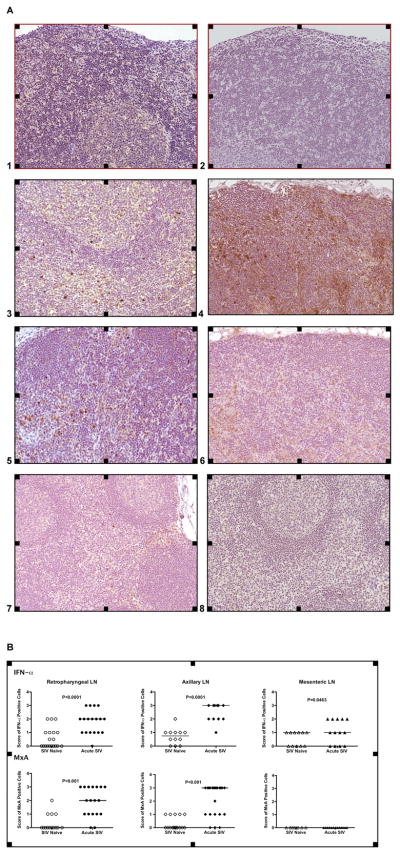
Figure 5.
Detection of IFN-α positive cells by IHC. Panel A: IFN-α (Images 1, 3, 5, and 7) and MxA (Images 2, 4, 6, and 8) positive cells (Magnification: 20x). Images 1 and 2 show IFN-α and MxA staining in retropharyngeal LN of SIV-negative age-matched infants (negative control). IFN-α and MxA positive cells of SIV-infected infants in the retropharyngeal lymph node (Images 3, 4), the axillary (Images 5, 6) and the mesenteric LN (Images 7, 8) show a brown staining pattern. Panel B: Relative frequencies of IFN-α and MxA positive cells. The individual scores of the relative frequencies of IFN-α and MxA positive cells in each analyzed microscopic field within the T cell area in the tissues of SIV-negative and SIV-infected infants. The scores were determined as described in Materials and Methods.

