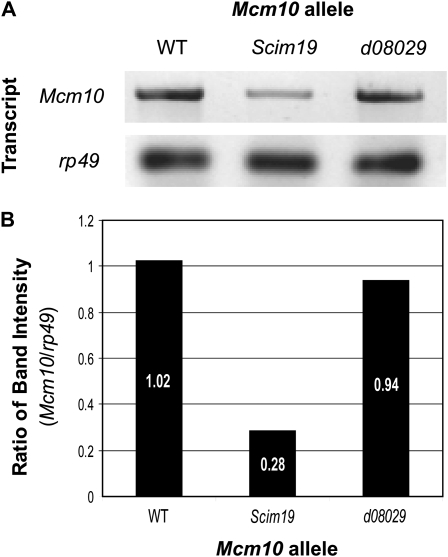
Figure 2.—
RT–PCR measurement of relative Mcm10 transcript levels in the two Mcm10 alleles. (A) Visualization of transcript levels in the respective genotypes with rp49 loading control. (B) Bar graph of transcript levels as a ratio of rp49 control show that transcription of Mcm10 is significantly lower in the Mcm10Scim19 background.

