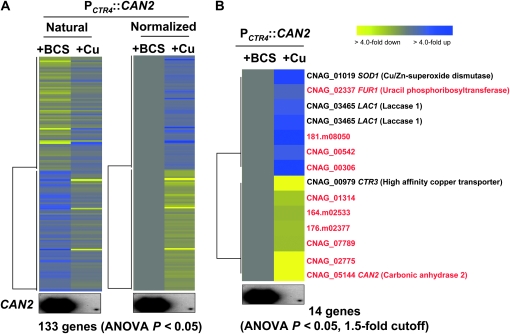
Figure 3.—
Genes regulated by differential CAN2 expression in the PCTR4∷CAN2 strain. (A) The hierarchical clustering analysis of 133 genes, which exhibited significantly different expression patterns (ANOVA test, P < 0.05) by comparing the transcriptome of the PCTR4∷CAN2 strain grown in YNB containing 200 μm BCS (+BCS, CAN2 overexpression) or 25 μm CuSO4 (+Cu, CAN2 repression) after a 12-hr incubation. (B) The tree view of 14 genes, which exhibited >1.5-fold induction or repression among genes showing significantly different expression patterns (ANOVA test, P < 0.05). The fold change is illustrated by color (see color bar scale in B).

