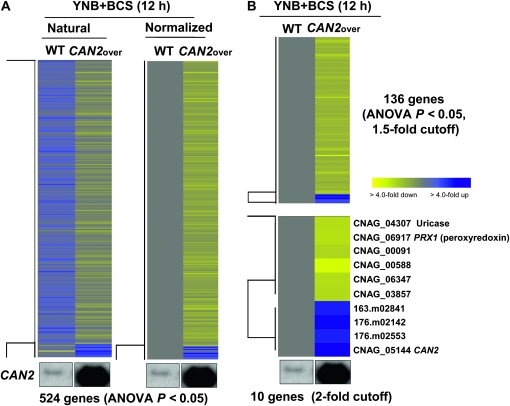
Figure 4.—
Genes regulated by CAN2 overexpression. (A) The hierarchical clustering analysis of 524 genes, which exhibited significantly different expression patterns (ANOVA test, P < 0.05) by comparing the transcriptomes of the wild-type H99 (WT) and PCTR4∷CAN2 strains “CAN2over” grown in YNB containing 200 μm BCS after a 12-hr incubation. (B) The tree view of 136 and 10 genes, which exhibited >1.5-fold or twofold, respectively, induction or repression among genes showing significantly different expression patterns (ANOVA test, P < 0.05). The fold change is illustrated by color (see color bar scale in B).

