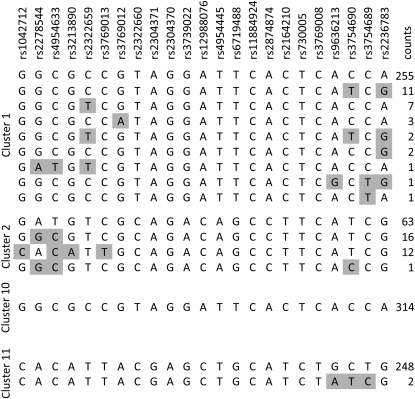
Figure 2.—
Haplotype clusters in the LCT gene. Four haplotype clusters from the LCT gene are shown. These clusters correspond to haplotype clusters from Figure 1 and are all located at rs12988076 (the central SNP of the 23 SNPs shown). Cluster numbering is from the bottom of the graph in Figure 1 to the top, so cluster 1 is the bottom-most cluster, cluster 2 is the cluster above that, cluster 11 is the topmost cluster, and cluster 10 is the cluster one down from the top. Each 23-SNP haplotype seen within the four clusters is shown, along with a count of the number of times that it was seen. Within each cluster, variants differing between the majority haplotype and other observed haplotypes are shaded gray.

