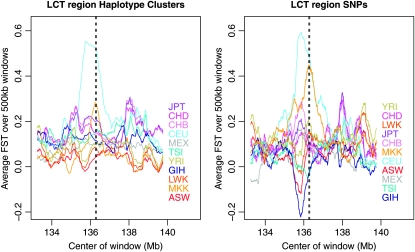
Figure 4.—
Population-specific FST estimates in the region of LCT for HapMap3 data. The location of LCT is shown with a pair of dashed lines. Haplotype-cluster-based estimates are shown on the left, while estimates based on SNPs are on the right. In both cases, the estimates are from 500-kb windows.

