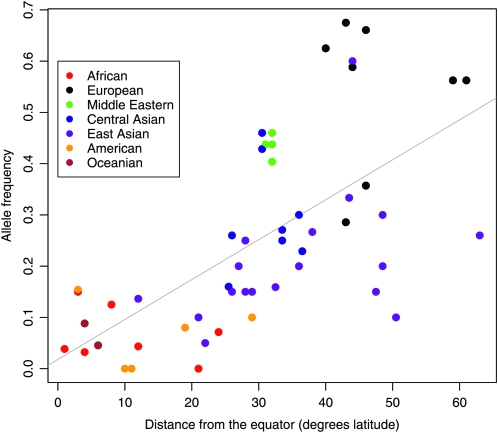
Figure 1.—
The distance from the equator for each of 52 human populations, plotted against sample allele frequencies for the SNP AGT M235T in each population. The points are colored according to the geographic region each population belongs to, following region definitions of Rosenberg et al. (2002). The data were generated using HGDP samples by Thompson et al. (2004) and are replotted on the basis of a figure in that article.

