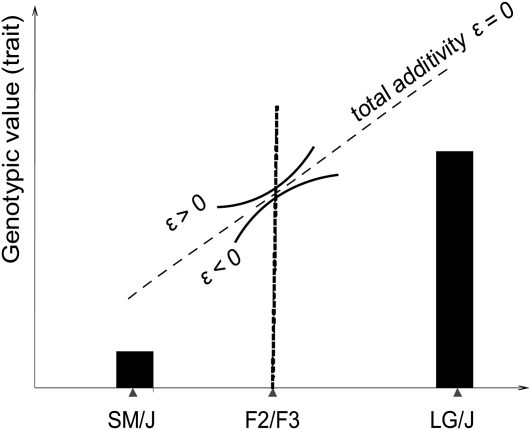
Figure 1.—
Directionality of epistasis describes the local curvature of the genotype–phenotype map. The genotypic values of the trait of interest in the two parental inbred populations and in an intercross are plotted on y-axis. Given a defined direction on a trait axis and a reference point for measurement of genetic effects, the directionality ( ) describes whether the epistasis increases or decreases the effect of allelic substitutions relative to the value predicted by additive effects alone. The extrapolation of the curvature beyond the local effects requires the knowledge of higher-order epistatic effects; however, the local effects can be calculated for different reference points and different phenotypic directions (see Hansen and Wagner 2001a,b).

