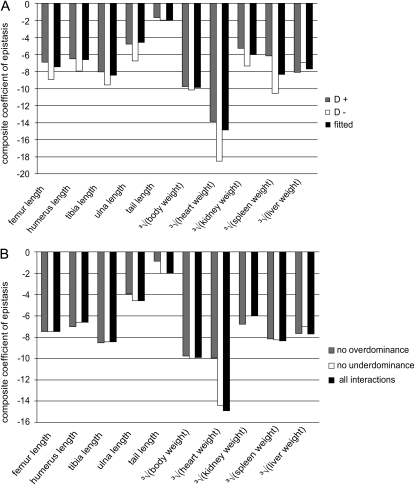
Figure 3.—
Effect of dominance on epistatic directionality. (A) The resulting composite epistatic coefficients if all interactions are modeled with (shaded) and without (open) dominance. The solid columns show the results based on the applied method of selecting interaction with or without dominance based on the better fit to data. (B) The effect of under- and overdominance on directionality of epistasis. The overall directionality of epistasis resulting from data excluding the interactions with overdominance (shaded) or underdominance (open) is compared to the case where all interactions are included (solid). Note that in spite of some difference in absolute values of epsilon, the pattern is unchanged. The coefficients are unitless and the traits are on the linear scale in both plots.

