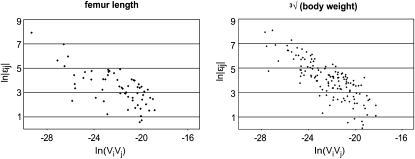
Figure 4.—
The relation between the epistatic coefficient and additive variance across interactions. The two exemplary scatter plots show the decrease of the pairwise epistatic coefficient with increased additive variance at the loci involved in interaction. The plots are on log–log scale and use absolute size of epsilon, as the sign is irrelevant in this context. Note that when additive effects are small, even small epistatic effect on phenotype results in large estimated epsilon, and vice versa.

