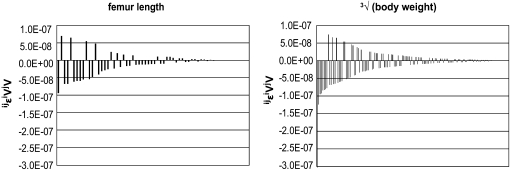
Figure 5.—
Distributions of weighed epistatic effects on phenotype. The weighed effects ( iVjV) of single epistatic interactions are ordered from largest to smallest according to their absolute magnitude. The asymmetry of the distribution is an indication of directionality of epistasis. Two exemplary traits corresponding to those in Figure 4 are represented on the same scale, and the remaining traits follow a similar pattern, with varying absolute effect sizes. The single bars represent single interactions, ordered from left to right according to their decreasing absolute size. They can be positive or negative on the y-axis, while the x-axis has no quantitative meaning. The traits are on a linear scale.

