
Figure 4. There are more colonies surviving in MMC for FancA-sW transduced human FANCA bone marrow cells than for the control GFP vector transduced cells.
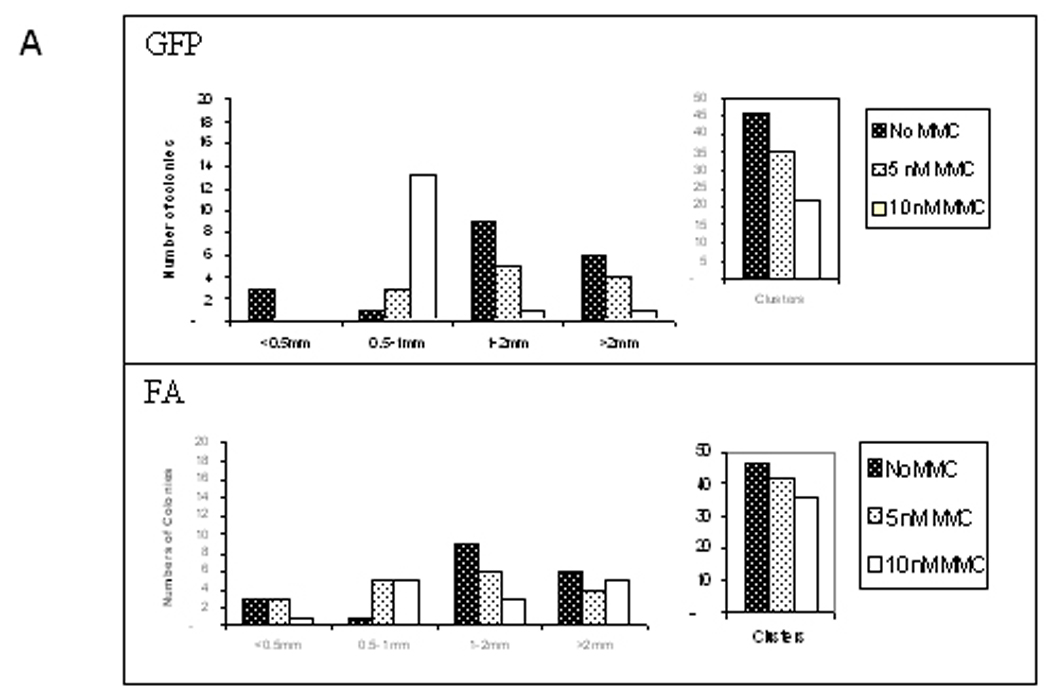
A) Patient 5 colony size distribution in increasing concentrations of MMCNote that there were fewer larger colonies in 10 nM MMC for the control GFP vector transduced cells than for the FancA-sW transduced cells. With increasing MMC concentration, there were fewer colonies or cell clusters, and the effect was more pronounced for the control GFP vector transduced cells than for the FancA-sW transduced cells. B) Patients 5, 6, and 7 colony numbers in different concentrations of MMC. There were fewer colonies for the GFP vector transduced cells than for the FancA-sW transduced cells, and the differences in colony numbers were statistically significant for the indicated MMC concentrations. For patient 5 at 0 nM MMC, p=0.035, at 10 nM MMC p=0,030, and at 20 nM p=0.26; for patient 6 at 0 nM MMC p=0.001, at 10 nM MMC p=0.009, and at 20 nM MMC p=0.45; for patient 7 at 0 nM MMC p=0.086 and at 20 nM MMC the colony numbers were too low for statistical analysis.