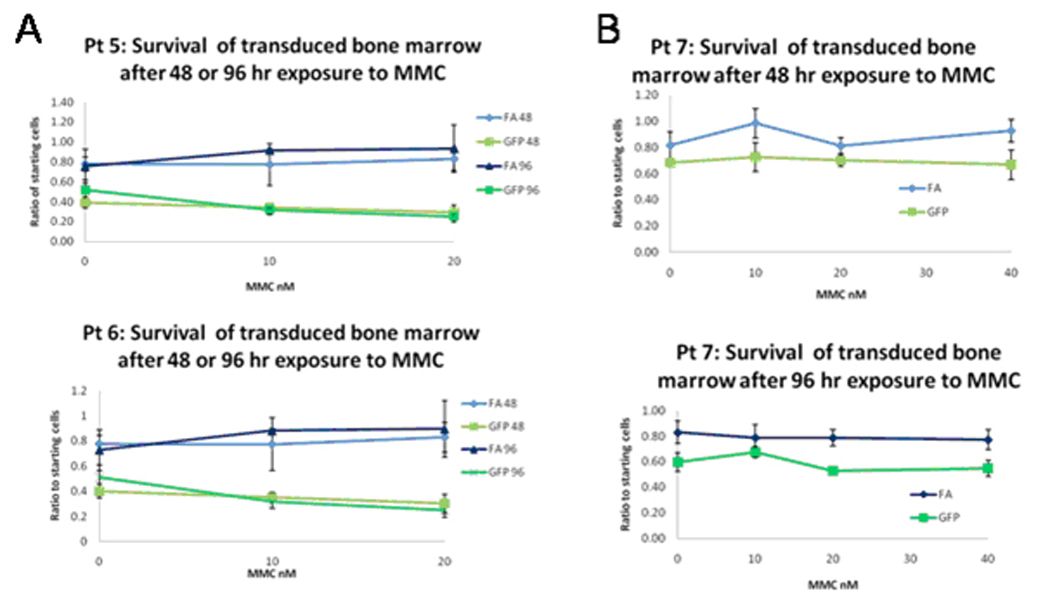
Figure 6. Transduced CD34+ FA patient bone marrow cells form colonies and survive mitomycin C (MMC).

The x-axis indicates the MMC concentration, 0, 10 or 20 nM for the cells plated in methylcellulose. The y-axis indicates the colony number as percent of the no MMC number. Note that there are a statistically significant higher number of colonies at 10 and 20 nM MMC for the FancA-sW transduced CD34+ cells compared to transduced mononuclear cells. The p values are indicated on the graph.
