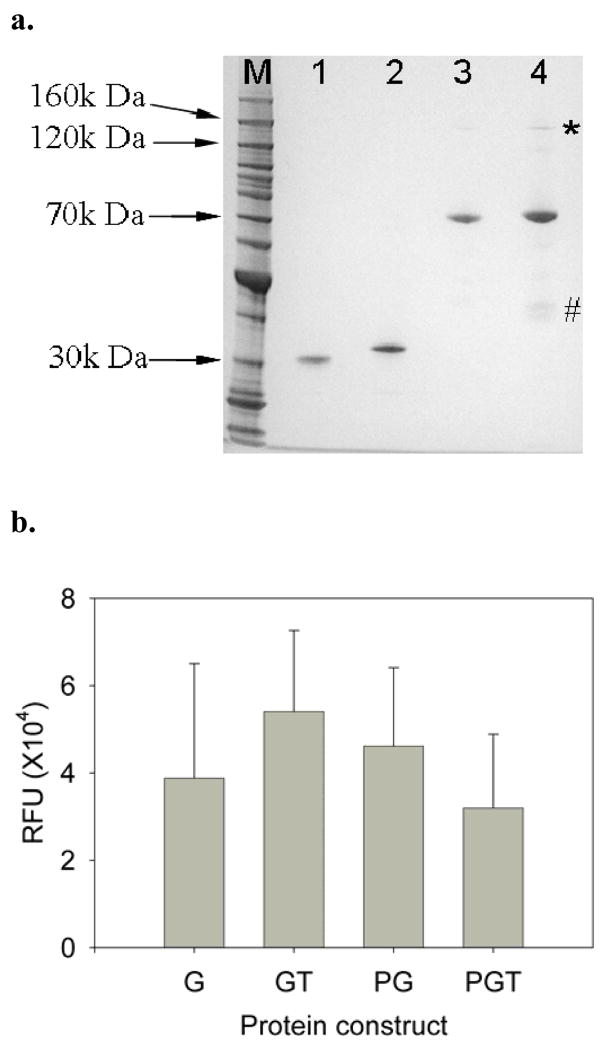
Figure 2.
(a) SDS-PAGE of the recombinant protein constructs. Molecular weight markers are in lane 1, G is in lane 2, GT is lane 3, PG is in lane 4, and PGT is in lane 5. All proteins migrated at their expected molecular weights. The * indicates possible dimer formation by PGT, and PG to a lesser extent. The # indicates possible degradation products of the PGT construct. (b) Molar fluorescent intensities of purified recombinant proteins. Error bars represent standard errors. Each experiment was performed in at least triplicate (n ≥3).

