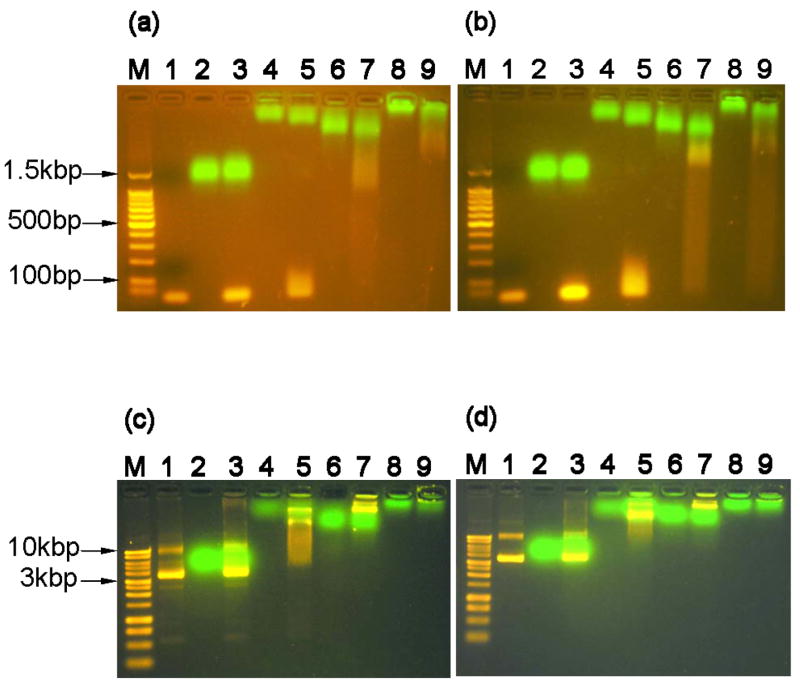
Figure 4.
Protein and DNA interactions monitored by agarose gel electrophoresis retardation. (a) mixtures of proteins and linear DNA containing the target-κB binding site (30bp in length, 0.2nmol protein to 0.01nmol DNA, 1.5% agarose gel), lane M: 100bp DNA molecular weight marker, lane 1: neat dsDNA oligonucleotide, lane 2: G, lane 3: G+DNA, lane 4: GT, lane 5: GT+DNA, lane 6: PG, lane 7: PG+DNA, lane 8: PGT, and lane 9: PGT+DNA. (b) mixtures of proteins and linear DNA without the target-κB binding site (33bp, same molar ratio and agarose gel concentration) with same lane assignments as panel A. (c) mixtures of proteins and plasmid DNA containing the target-κB binding site (~4.6kbp DNA, 0.2nmol protein : 200ng plasmid DNA, 1.0% agarose gel). Lane M: 1kb DNA molecular weight marker, all other lane assignments the same as panel A. (d) mixtures of proteins and plasmid DNA without the target-κB binding site (same plasmid size, molar ratio, and agarose gel concentration) with same lane assignments as panel C.

