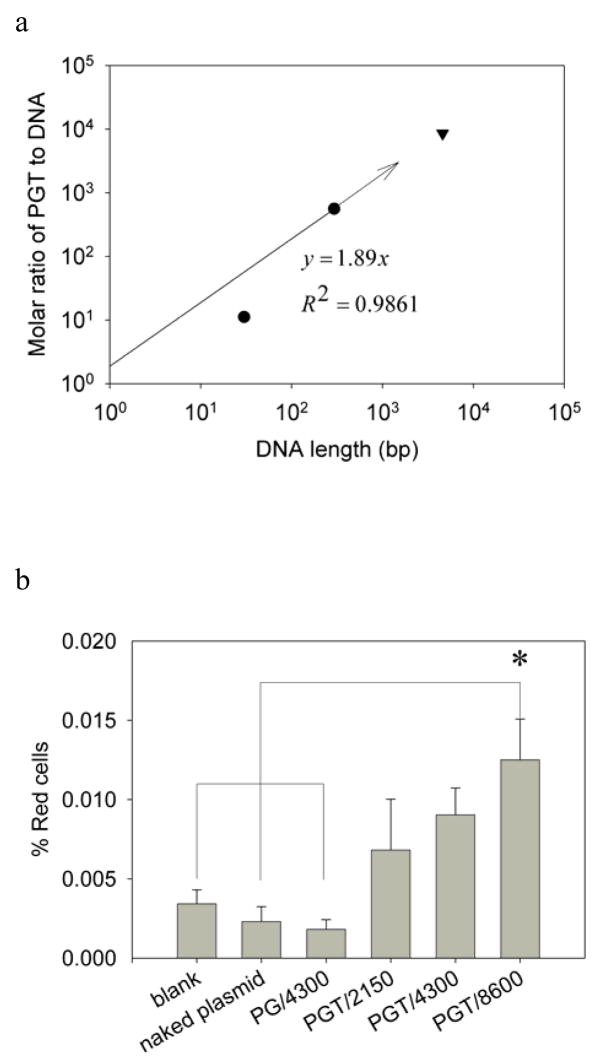
Figure 6.
(a) Log-log plot of the correlation of the molar ratio needed for optimal transfection efficiency as a function of the length of the delivered DNA cargo into PC12 cells. The optimal molar ratios, 28:1 for 30bp DNA cargo (●) and 560:1 for 293bp DNA cargo (●) were obtained from PGT mediated linear DNA delivery experiments while the optimal molar ratio needed for delivering 4.6kbp plasmid (8600:1) was predicted from the correlation (—) based on 30bp and 293bp DNA cargos as the intercept of the linear fitting equation was set at the origin. (b) Delivery of the pDsRed-BD plasmid to PC12 cells using the chimeric protein constructs. Error bars represent standard errors. Each experiment was performed five times (n=5). The * indicates the value is significantly different from the untreated cells, neat plasmid transfected cells and PG plasmid complex at molar ratio of 4300:1 transfected cells using one way ANOVA and post-hoc Tukey’s test (p<0.05).

