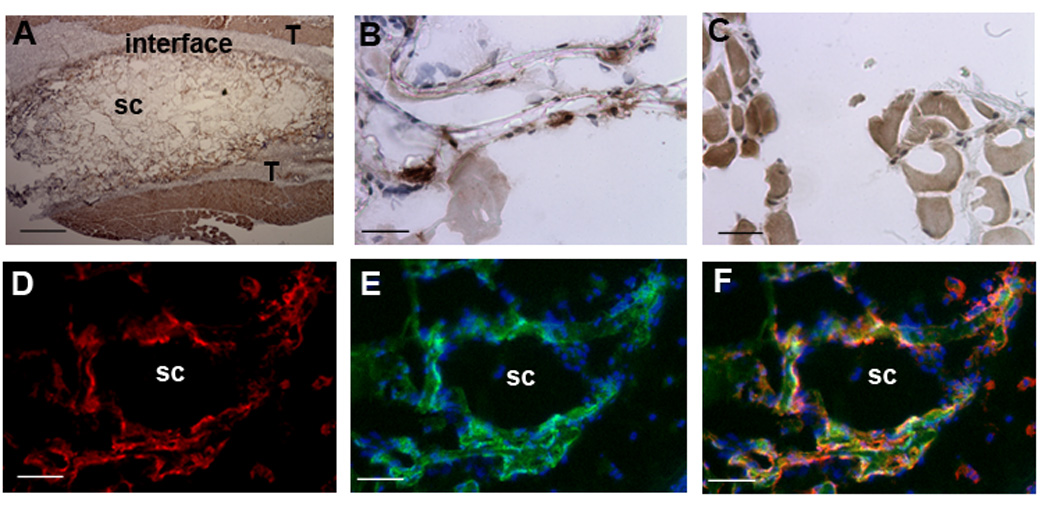
Figure 3.

Transfection at the implant site. Images captured for sections stained with antibodies to GFP (A-C) using a biotinylated secondary antibody for HRP staining (brown), and (E-F) fluorescently labeled secondary antibody (green). (A) Image of the scaffold (sc) and surrounding tissue (T) at low magnification. Images captured within the scaffold (B) and at a distance of approximately 100 µm from the scaffold-host tissue interface (C). Sections were also stained with antibodies to F4/80 (D, red). An overlay of GFP (green) and Hoechst (blue, nuclei stain) (E), and (F) an overlay of panels D and E. Scale bars: A, 400 µm; B-C, 25 µm, D-F, 50 µm.
