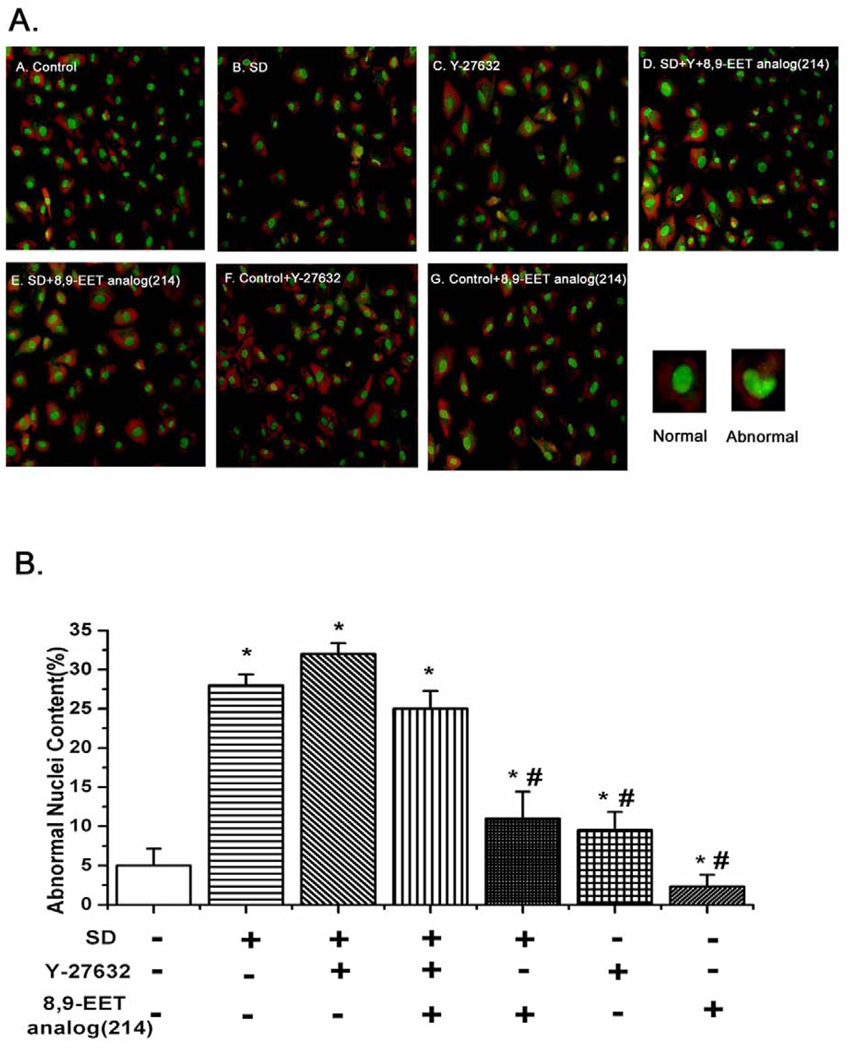
Fig. 7.
8,9-EET analog(214) suppresses the nuclear deformation and chromatin condensation via ROCK. A: PASMCs were treated the same way as in Fig. 5A, and then stained with AO (acridine orange). The percentage of cells with abnormal nuclear contour was quantified by fluorescent microscope after staining with AO. Representative images from each of the 7 groups of cells studies are shown as labeled. B: Quantitative analysis of abnormal nuclei content (crenation, condensation and fractionation) in different groups. The percentage of abnormal nuclei from images of ten randomly selected fields in each group of cells is shown. All values are denoted as means ± S.E.M. from ten independent photographs shot in each group (*p<0.05 compared with Control; #p<0.05 compared with SD).

