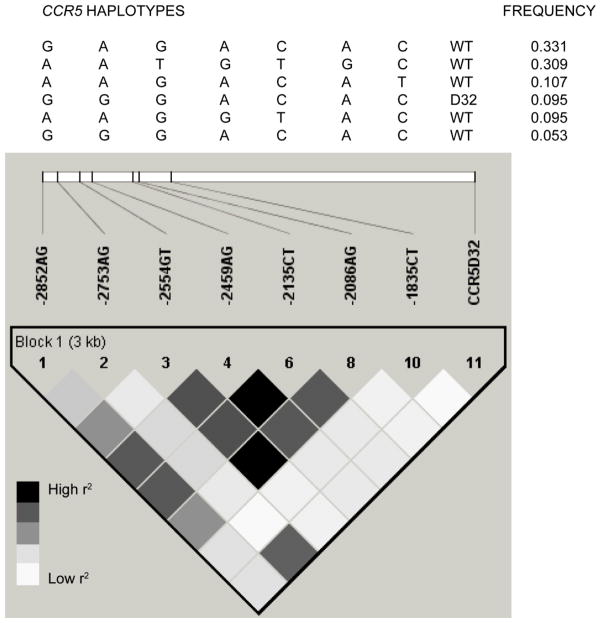
Figure 1. Linkage disequilibrium and haplotypes at the CCR5 locus.
An LD plot is depicted in the bottom part of the figure based on the measured r2. Each square represents the magnitude of LD for a single pair of markers, with black color indicating high r2. A key is provided below the LD plot. Analysis of this LD plot suggests the presence of a single haplotype block. Haplotypes spanning this block are shown above the LD plot, along with their frequency among unrelated, unaffected parents. Only haplotypes with a frequency >5 % are shown. The haplotypes were formed by SNPs at positions −2852, −2753, −2554, −2459, −2135, - 2086, and −1835 relative to the translational start site, and the CCR5-Δ32 polymorphism in the open reading frame on exon 3 of the CCR5 gene. Unrelated, unaffected parents of the multiplex families were used for the haplotype and LD analysis of all pairwise comparisons, with the exception of the comparison between the CCR5 C-1835T and CCR5-Δ32 polymorphisms, for which the unrelated, unaffected parents of all the simplex and multiplex families were used. CCR5 C-1835T and CCR5-Δ32 were 2.3 kb apart, and had a D′ of 1, but r2 of only 0.012. The frequencies of the CCR5-1835C-CCR5 WT, CCR5-1835T-CCR5 WT, CCR5-1835C-CCR5 Δ32, and CCR5-1835T-CCR5 Δ32, two-locus haplotypes were 9.9 %, 80.4 %, 9.7 % and 0 % respectively.

