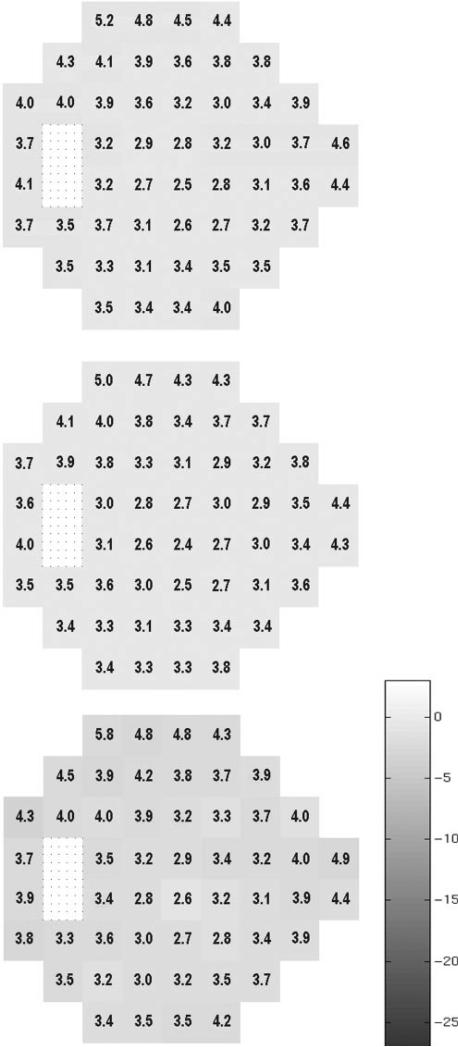
Figure 1.
The mean grayscale pattern generated by the algorithm for the individuals in cluster 5 relative to the 189 normal eyes. The grayscale is based on the mean difference in decibels of each visual field location from the average sensitivity of the 189 normal eyes. Each location of the visual field is represented with a box, and the appearance of each box was determined with quantification rather than interpolation as found in the grayscale field usually associated with visual field printouts (as in Fig. 3). The numbers superimposed on each location are the standard deviations of the difference in sensitivity for all eyes in the cluster (top), normal eyes only (middle), and the 46 patient eyes (bottom). The bar next to these patterns depicts the grayscale range used by the vbMFA with darker areas denoting greater loss of sensitivity. By definition the grayscale in the middle of Figure 1 shows very little mean deviation, since these 186 eyes are part of the full 189.

